Bermuda 1-2.
Reprinted from the SailFast June 2015 Newsletter
The Bermuda 1-2 has started and Marion-Bermuda is coming soon. It always important to analyze what the Gulf Stream is doing and factor it into your overall race strategy. Knowing exactly where the stream, its strength and how it may change by the time you get there is always a bit dicey. Each expert has their preferred sources of information and the prudent navigator will consider more than one source for their analysis. What makes it interesting is that virtually all Gulf Stream current information relies on measurement of indirect parameters such as altimeter surface height or temperature, and models that predict the corresponding surface currents.
SailFast can be great tool to help in the analysis. Let's see what we might do if we started racing from Newport or Marion at 12 noon today. We'll race with polars for our Sabre 38 test boat, use NOAA GFS grib wind predictions and NOAA RTOFS for Gulf Stream current and sea temperature. This optimum routing analysis is done with 2 hour time steps. The displayed blue isochron lines show where we could be every 4 hours during the race.
Figure 1 shows a portion of the optimum route. Total time to the finish is 110 hours. The course takes us West of the rhumb line to avoid the unfavorable NW current flow. We enter the favorable meander around 69d 32' W, 37d 48' N, which is about 50 nm West of the rhumb line. From the isochrones we see that we will be in the favorable current for just 8-12 hours.
For comparison refer to Frank Bohlen's May 29th analysis
on the Marion Bermuda web site and his updated
Note 3 June 3rd analysis
on the Bermuda 1-2 web site.
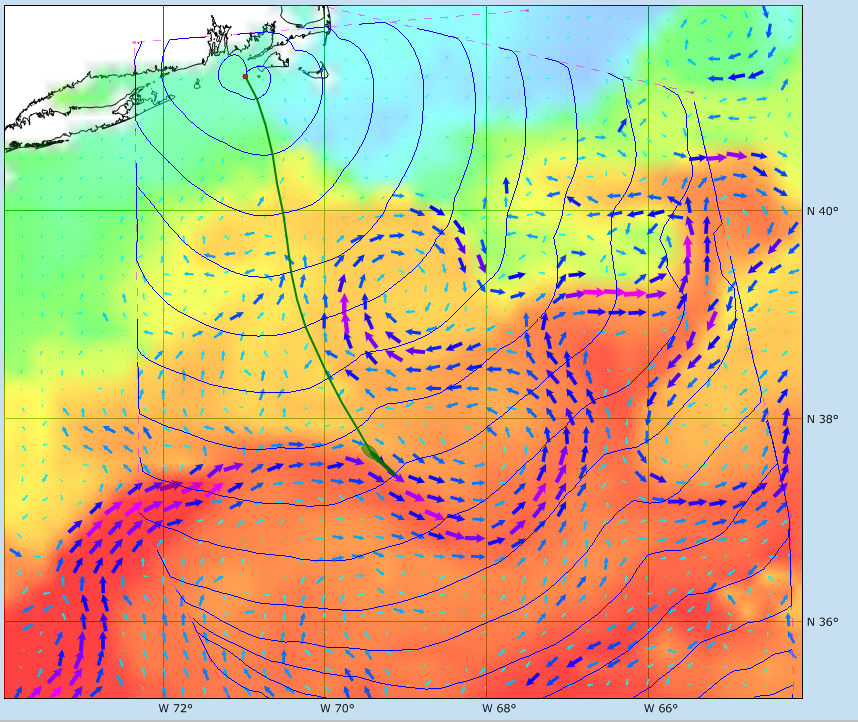 Figure 1 Fastest Course 110 hours
It's useful to know what may happen if we choose to sail the rhumb line instead. There is always some risk in sailing a longer distance than necessary.
Here we have inserted a sailing boundary line that prevents sailing West of the rhumb line near the unfavorable current. The optimum solution with this constraint causes us to sail about 20 nm East of the rhumb line. The finish time is now 110.3 hours, essentially the same as the first optimum solution.
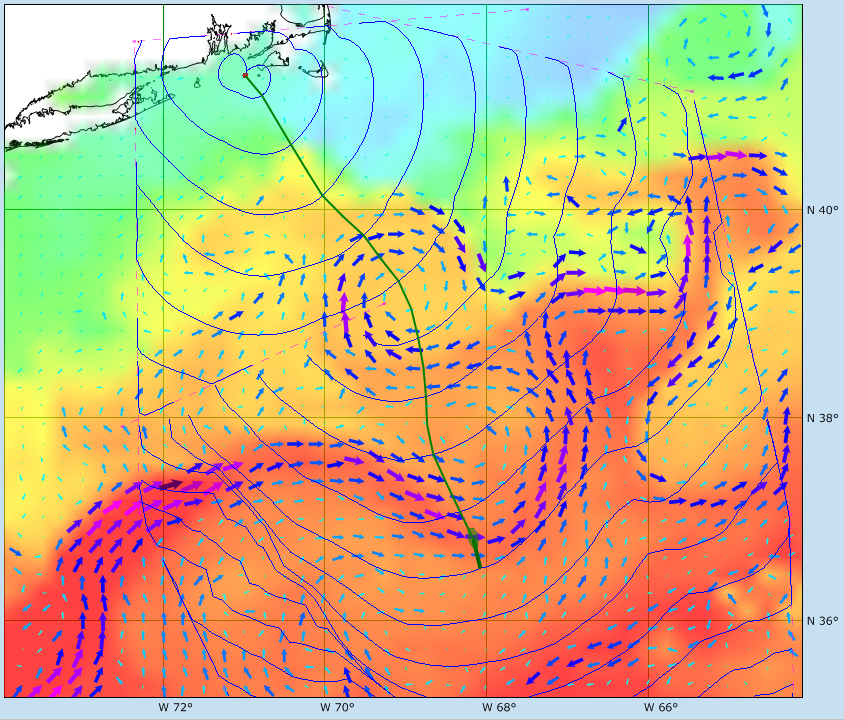 Figure 2 Rhumb Line Course, 110.3 hours
The impact of the Gulf Stream is important to consider, however the wind is often the dominate factor. It's hard to beat the advice - "sail where the wind is strongest". Let's look at the forecasted wind for our race. Figure 3 shows the wind and mean sea level (MSL) pressure 24 hours after the start. The wind is 19.8 kt and our boat speed is 8.6 kt. We are flying !
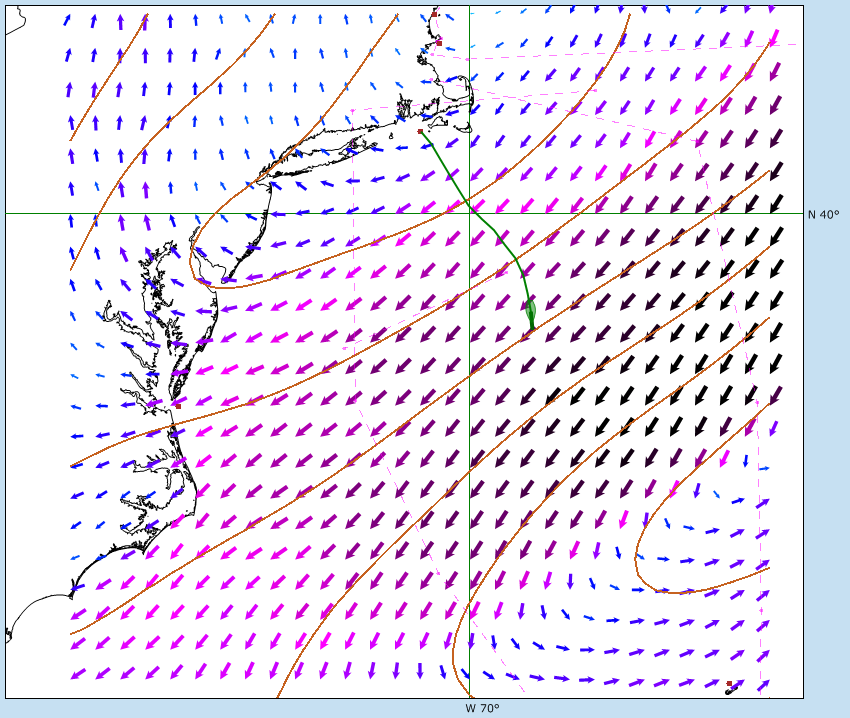 Figure 3 + 24 hours
The wind has dropped to 10.8 kt but we are still moving well at 7.8 kt boat speed and SOG. We are past the favorable meander at this point.
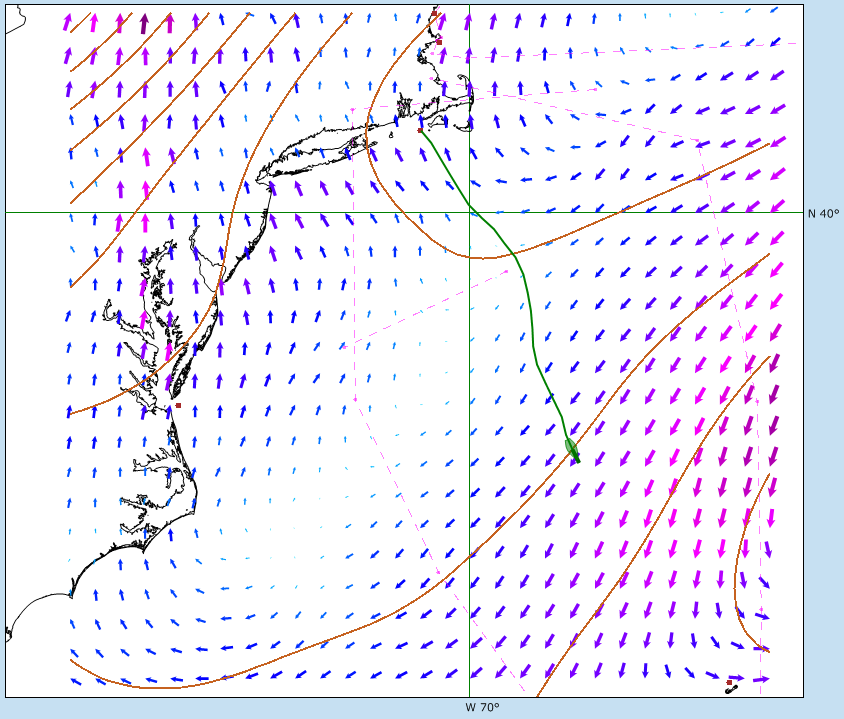 Figure 4 + 40 hours
Figure 5, 60 hours from the start and 175 nm from the finish. Overtaken by the high. Wind 2.4 kt, boat speed 2.2 kt. Its hot and the crew is cranky.
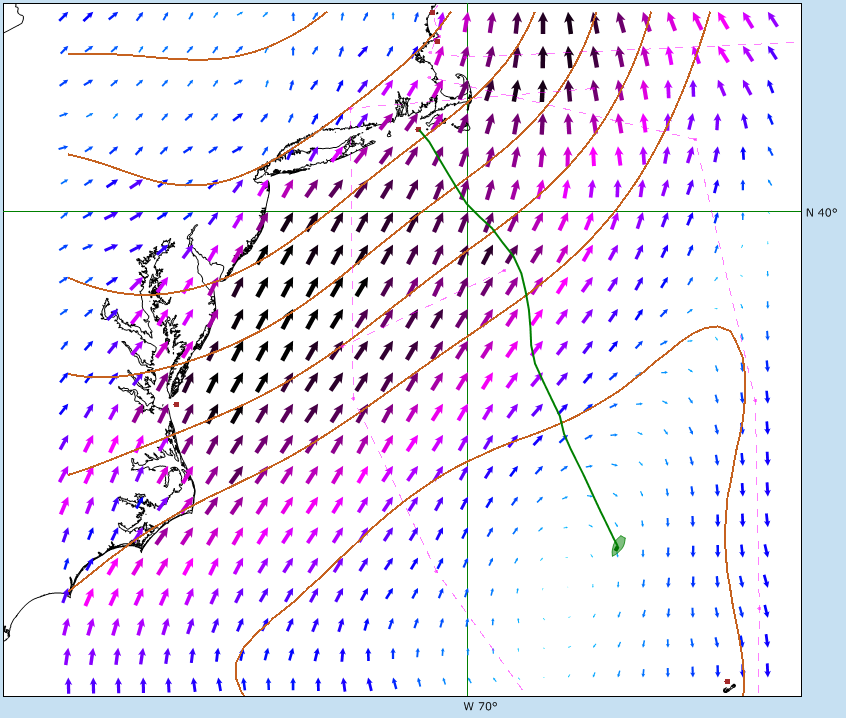 Figure 5 + 60 hours
Average boat speed for the last 175 nm is 3.5 kt. Painfully slow. Wish we could have stayed ahead of that high. The compressed blue isochrones show hownthe high pressure/light winds moved in from the West and killed boat speed.
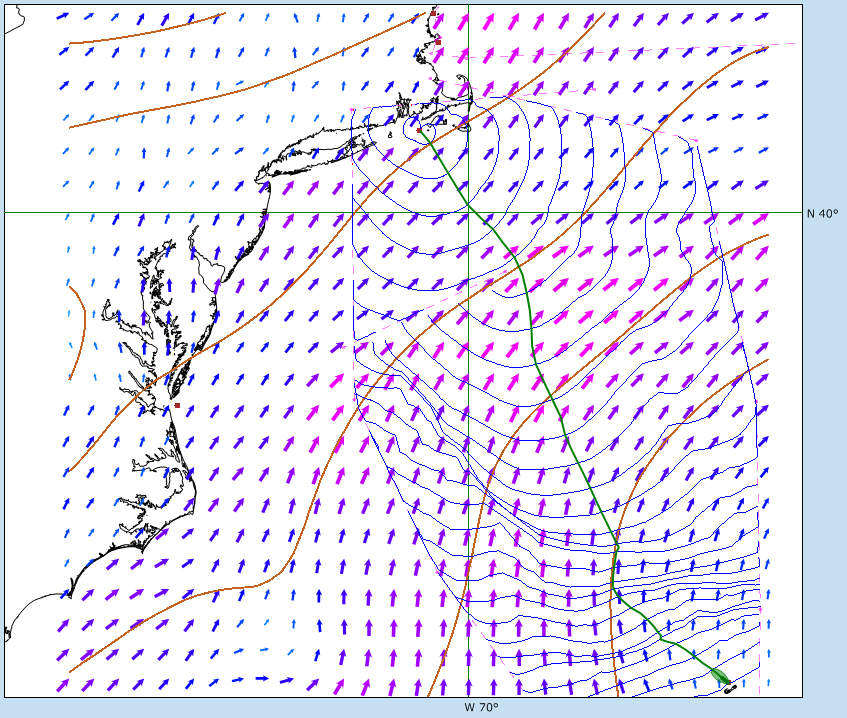 Figure 6 Finish, 110.3 hours
While racing to Bermuda it is highly useful to know what the actual current is. Accurate logging of current will help identify minor eddies and confirm the accuracy of your forecasted Gulf Stream, whether from satellite altimeter data or a computational model like RTOFS. Once in a favorable meander a good current log will help optimize for max benefit. Does sailing left or right improve the current? What about VMG? SailFast has the ability to compute and log actual current in real-time. Learn more from our App Note