It's a week from the start and if you are a navigator you are probably deep into analyzing the Gulf Stream and planning a routing strategy. If you are doing this all manually you are missing out on the benefits of using a weather routing application to both gather weather and Gulf Stream predictions, and test out various routing choices. I'm going to show what you could do with SailFast to prepare for the race, based on forecasts as of June 6th. Of course by race time I'd expect some significant changes to the wind forecast which could significantly alter your actual strategy. During the race you would also want to get updated wind forecasts once or twice a day, run new weather routing solutions and update your plans as appropriate. You can also download Gulf Stream updates during the race but you won't need many since the stream changes relatively slowly. With appropriate boat instruments interfaced to SailFast you can also measure and record actual current (Set & Drift)
during the race, which can be useful for fine tuning you sailing to maximize favorable currents. See our Set & Drift app note to learn more.
Figure 1 shows NOAA's RTOFS model forecast for sea surface temperature and current, valid for June 6th at 11 AM. The RTOFS Grib file we will be using includes forecasts in 3 hour increments out to June 11 at 8 PM. So for any routing simulations performed the Gulf Stream current employed is determined by both the boats position and the date-time. This also holds true for the wind forecast. RTOFS is a numerical computational model based on our understanding of the fundamental physics involved. The model is initialized by assimilating satellite measurements of sea surface temperature and height.
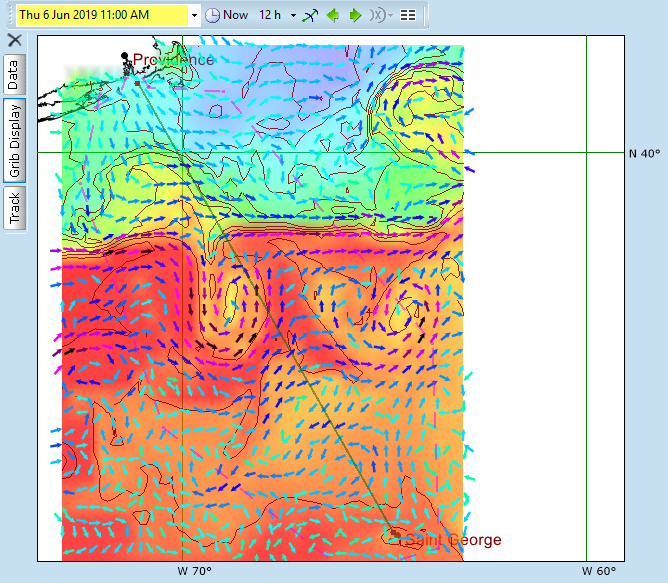
Figure 1. Sea Temp & Current June 6
When possible, it is always prudent to compare computational models to real measurements to validate the model results and decide if they should be trusted. Comparing the RTOFS forecast to Frank Bohlen's Gulf Stream Note #3 - June 6 we find generally good correlation. Assuming the model is accurate, we can now easily view the predicted current velocity and direction anywhere, and SailFast can use it to perform exhaustive weather routing calculations.
For the purposes of this weather routing analysis we are going to use a race start time of June 6th at 1 PM. This lets us use NOAA's GFS wind and mean sea level pressure forecast valid for June 6th, with updates every 3 hours for the duration of the race. So let's take a quick look at the GFS forecast for the first 3 days. At the start of the race (Figure 2) the wind is Westerly at 12 kts. A day later, June 7 at 1 PM, a low is centered at 38N 71W and wind to the North is now Easterly at 9 kts. By day 3 of the race area around the Gulf Streams meander is experiencing very light winds < 5 kts and a low has developed about 130 NM Northeast of Bermuda. These complex winds will make navigating the Gulf Stream especially challenging. Next - Let's see what SailFast recommends for the optimum routing.
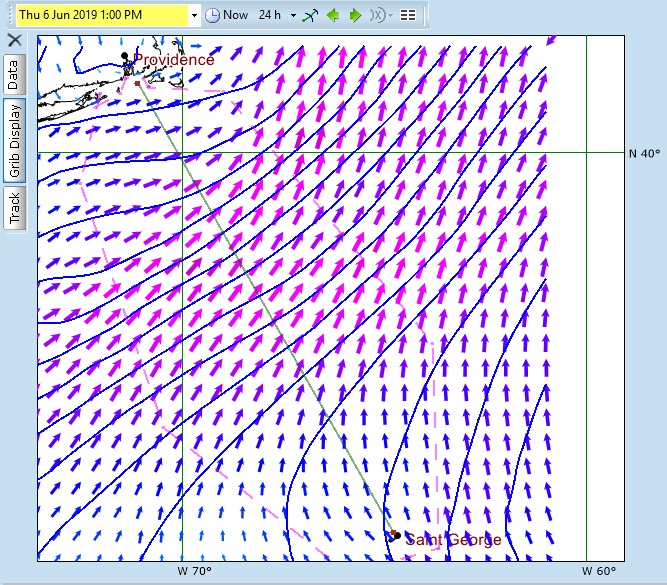
Figure 2. Wind & MSLP June 6 1 PM
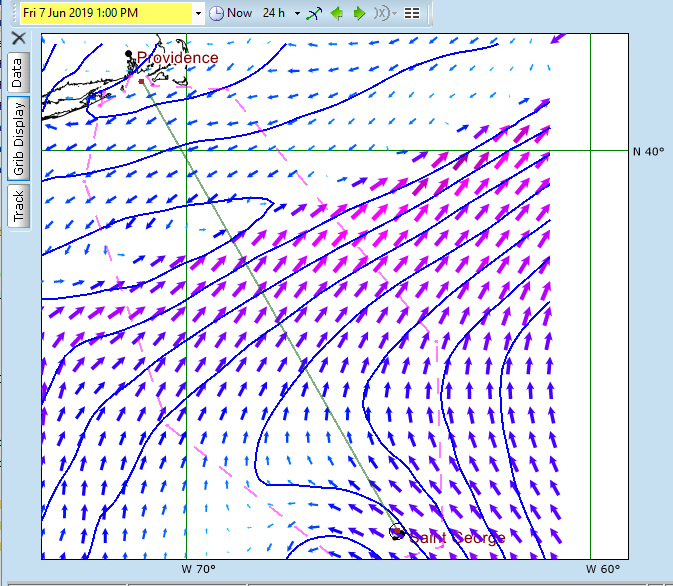
Figure 3. Wind & MSLP June 7 1 PM
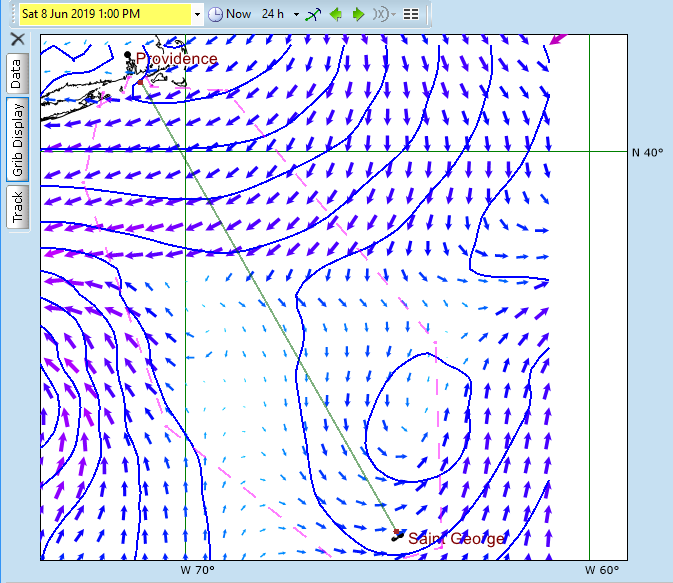
Figure 4. Wind & MSLP June 8 1 PM
Figure 5 shows the fastest route to the finish with an elapsed time of 89.8 hours. This routing is for a Beneteau First 40.7, using one of the 15 boat polars included with SailFast. A bit surprisingly to route swings about 50 NM Northeast of the rhumb line. This is a result of the very weak winds in the region of the Southerly meander. The blue contour lines in the plot are "isochrons", showing possible boat positions every 2 hours. The actual routing calculations where done in 1 hour increments. The distance between adjacent isochron lines is proportional to boat speed, which is affected by both wind and current.
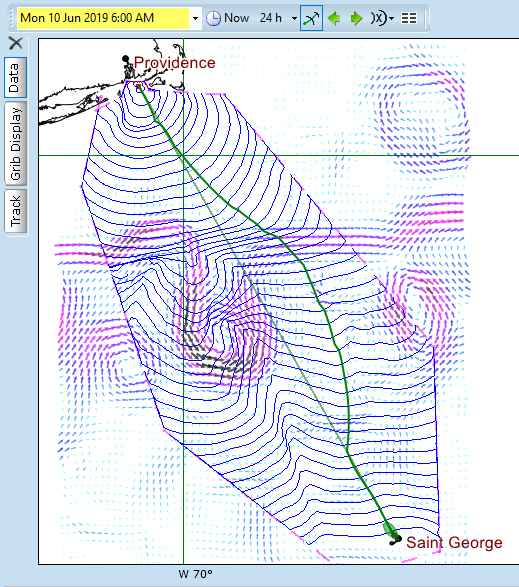
Figure 5. Optimum Route, 89.5 Hours
We would like to know what the elapsed time would be if we chose to sail in the favorable meander. We can force a different routing by adjusting boundary lines to block other sailing routes. Figure 6 shows the addition of a boundary line that blocks sailing East of the favorable meander. The resulting meander routing yields elapsed time of 103.6 hours, 13.8 hours slower than the optimum route.
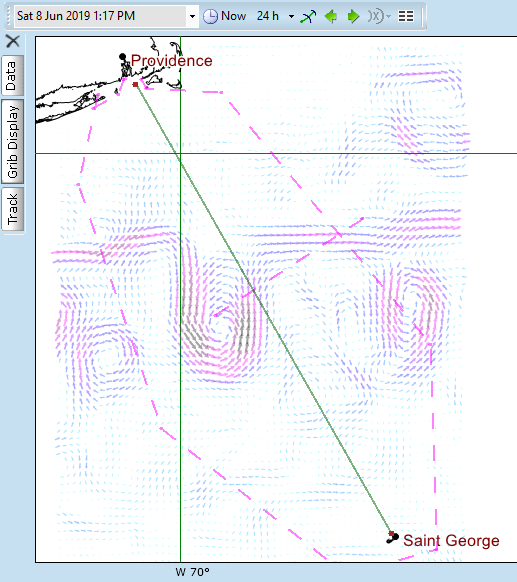
Figure 6. Boundary Change
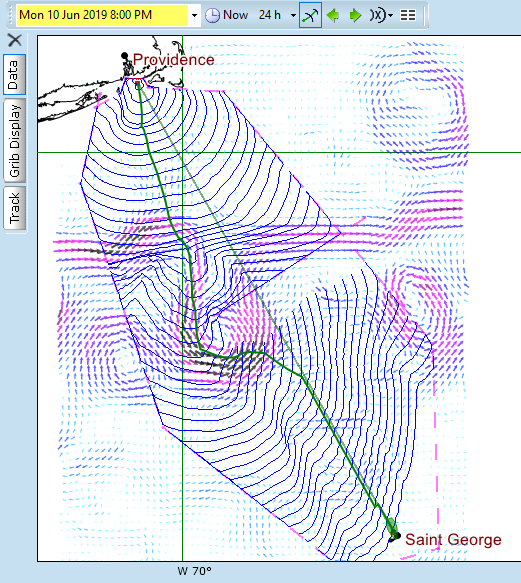
Figure 7. Meander Routing, 103.6 Hours
Since the wind forecast used in these routing examples is complex and actual race conditions will be different, let's try a few "what-if" routings. We will arbitrarily override the wind forecast and instead use a fixed West wind of 10 kts 270 degrees for the duration of the routing.
Figure 8 shows a routing of 88.8 hours using the favorable meander. A boundary line blocks sailing East of the rhumb line as before. It is interesting to note that the route cuts through the middle of the meander instead of sailing further West where favorable current is stronger.

Figure 8. Meander Routing, Wind 10 kts 270 deg, 88.8 Hours
After removing the blocking boundary line we obtain the optimum route for the 10 kt Westerly wind. The course is now East of the rhumb line with elapsed time 3.7 hours less, at 85.1 hours.
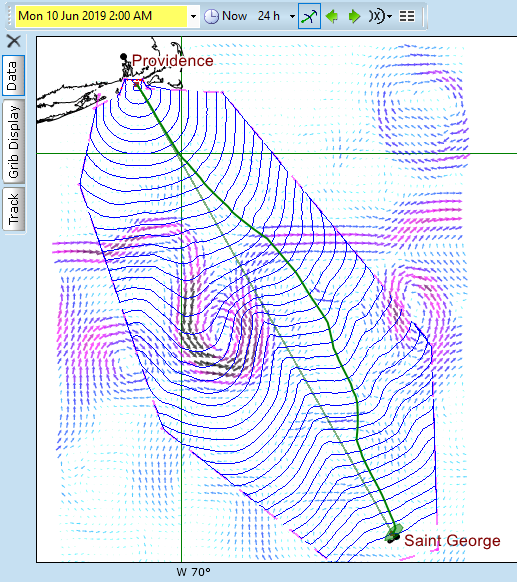
Figure 9. Optimum Route, Wind 10kts 270 deg, 85.1 Hours
Finally we will do a simple sanity check of our routing program and disable the RTOFS current forecast. The routing with fixed 10 kt wind and no current is as expected in Figure 10. The route sails straight down the rhumb line from start to finish.
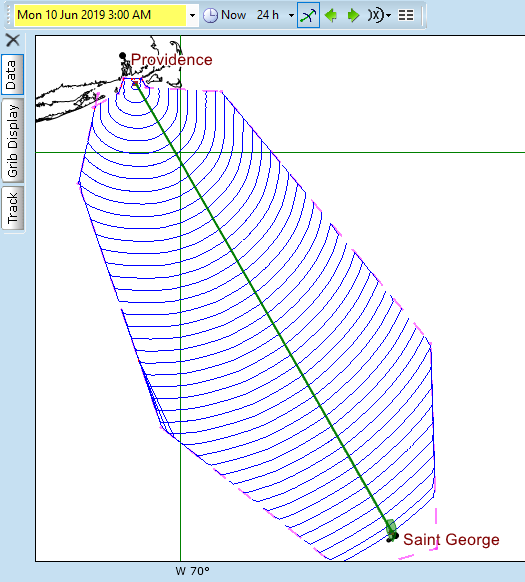
Figure 10. No Current, Wind 10 kts 270 deg, 86.3 Hours